Spencer’s Blog July: Return Envy

What should I be invested in? Should I change my investments? How much risk am I taking? How do I know if my investments are diversified? We all face these questions when saving for retirement.
Participants with retirement accounts often find selecting an investment based solely on past performance as a logical thing to do. It may even seem like the only thing to do. Look at your most recent retirement plan statement, what do you see? Asset Class, Fund Name, Expense Ratio, Trailing Performance. Can you use this limited amount of information to make your investment decisions? In this paper, we will walk through an experiment to show how chasing returns can be detrimental to your long-term investment goals.
To begin, we’ll define an asset class investment universe that is typically found in a traditional 401k lineup: Large Cap Growth, Large Cap Value, Mid Cap Blend, Small Cap Growth, Small Cap Value and Intermediate-Term Bond. It is likely that you’ll find mutual funds in each of these Asset Classes on your plan lineup. For the sake of simplicity, we will ignore fees and performance will be calculated using the Morningstar Category Average[1] for the asset classes listed.
Let’s say you’ve been working and contributing to your 401k retirement plan since January of 1992, and like any prudent investor, you review your investment elections and the performance of your 401k account at the end of each year (at least).
What would happen if at the end of each year, you looked at your 401(k) statement and shifted 100% of your 401k balance into the asset class that performed the greatest over the past year? Assuming that if a particular investment is leading the pack, it will continue to lead the pack going forward (chasing returns).
If you followed this strategy, your first investment election in 1992 would have been to allocate 100% of your account to the Small Cap Growth Asset Class. Why? In 1991, Small Cap Growth led all the other asset classes and returned 57.3%. However, this trend didn’t continue through 1992. Small Cap Growth stocks returned 10.95% while Small Cap Value led the group, returning 19.74%. As a result, you move your investments to the Small Cap Value Asset Class for the year of 1993, and so on.
Now, it’s the end of 1999 and investing has been pretty rewarding up to this point. Your account return over the past 8 years is over 250%, you’ve seen just two years with a negative return, and the rest have returned almost 26% on average. This period in history was the longest economic expansion in the history of the United States[2]: steady job creation, low inflation, and rising productivity that resulted from a rapidly changing, tech driven world. “A rising tide raises all boats.” JFK said. This rising tide culminated as what we now know as the “Dot-Com Bubble.”
From 2000 to 2008, your account moved through all of the asset classes at least once, and generated a loss of -14%. After the -41% return your 401(k) realized in 2008, your first thought might be that the tide just isn’t rising anymore. However, during this 9-year period, 4 of the 6 asset classes have generated a higher return than your 401(k) account. In fact, Small Cap Value has generated over 60% growth and Intermediate-Term Bonds returned nearly 50%.
Assuming that you follow this process year after year until you reach the end of 2015, your annualized (yearly) gross return would have been 7.6%. Now, return isn’t everything, it is also important to assess the risk in your portfolio. The most common way to measure risk is to calculate the standard deviation of the returns. Your 401(k) strategy yields a standard deviation of 17%.
For reference, bonds are traditionally seen as a “low-risk” low-standard deviation investment and here we find that Intermediate-Term Bonds have a standard deviation of 5.5% and the S&P 500 has a standard deviation of about 17.8%. A simple way to compare the efficiency of a portfolio against another is to find the highest Sharpe Ratio[3]. This gives a quantitative way to answer the question, “How much return am I getting for the level of risk that I’m taking?”
How does the performance of your account stack up against the other Asset Classes and the S&P 500 over this time period? Take a look at the table below:
| Asset Class | Annualized Return 1992-2015 | Sharpe Ratio |
| Your 401(k) | 7.6% | 0.45 |
| Large Cap Growth | 7.7% | 0.37 |
| Large Cap Value | 8.1% | 0.51 |
| Mid Cap Blend | 9.7% | 0.56 |
| Small Cap Growth | 9.4% | 0.39 |
| Small Cap Value | 10.4% | 0.60 |
| Intermediate-Term Bond | 5.2% | 0.94 |
| S&P 500 | 9.0% | 0.51 |
We see that “Your 401(k)” lags every equity asset class on an annualized return basis, and according to the Sharpe Ratio, your 401(k) is the 5th most efficient investment over this time period.
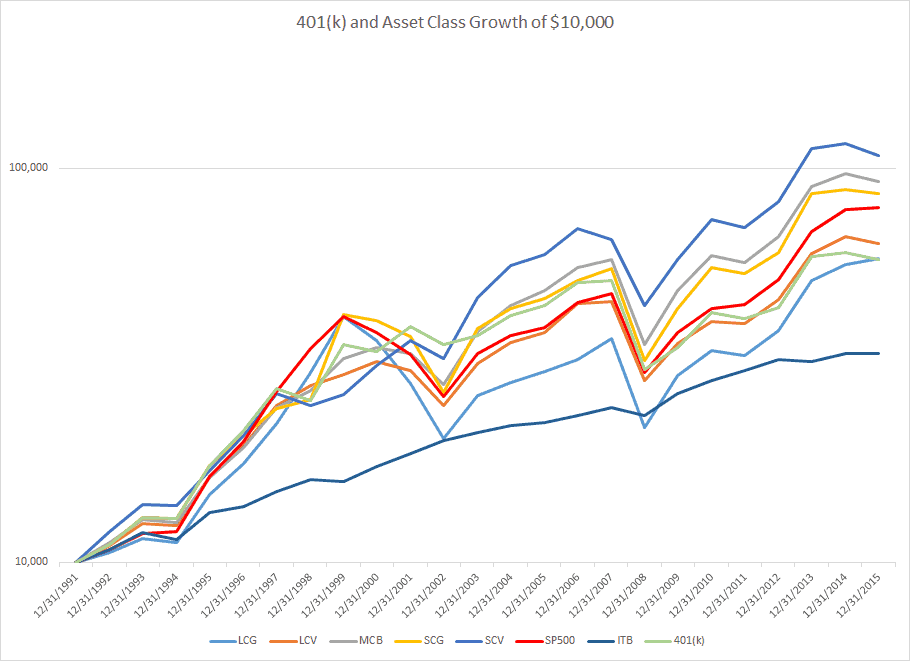
In the chart below, you can see the growth of the investments starting (with a $10,000 balance in each) on January 1, 1992. “Your 401k” growth is the light green line, and as you can see, it achieves the worst growth of any of the other equity asset classes. Simply buying and holding any of the equity asset classes over this entire time frame yields a higher gross return than your strategy.
At the risk of sounding redundant, past performance does not guarantee future results. This disclosure goes both ways, if a fund performs poorly over some time period, that doesn’t necessarily mean that it is going to continue to perform poorly, just as a top performing fund isn’t necessarily going to continue to outperform. Yes, it is difficult to look at a list of investments and not immediately gravitate to the fund with the highest numbers on the page, but all too often, investors use this as their investment selection criteria.
This experiment, although quite simple, proves a valid point. Investing in the asset class that’s winning today doesn’t mean you’ll be winning tomorrow.
[1] For any given datapoint, the category average is the simple average of all the values for that datapoint for all the funds within a particular Morningstar Category.
[2] https://en.wikipedia.org/wiki/1990s_United_States_boom
[3] Sharpe Ratio in this report is taken as the Annualized Return divided by the Annualized Standard Deviation.
Stay informed
Sign up for our monthly newsletter and take control of your financial future.